On-chain data shows the Bitcoin “Liquid Inventory Ratio” has dropped to an all-time low. Here’s what this could mean for the asset.
Bitcoin Sell Side Liquidity Is Low Relative To Demand Right Now
In a post on X, CryptoQuant founder and CEO Ki Young Ju discussed the recent trend in the Liquid Inventory Ratio for Bitcoin. The Liquid Inventory Ratio is an on-chain indicator that tells us about how the total sell-side liquidity inventory of the asset compares against its demand.
The sell-side liquidity inventory of the asset is gauged using four factors: the total exchange reserve, miner holdings, OTC desk holdings, and US government-seized BTC.
Out of these, the exchange reserve (that is, the total amount sitting in the wallets of centralized exchanges) is the largest potential source of sell-side liquidity.
The chart on the right below shows how the sell-side liquidity inventory of the coin has changed over the last few years:
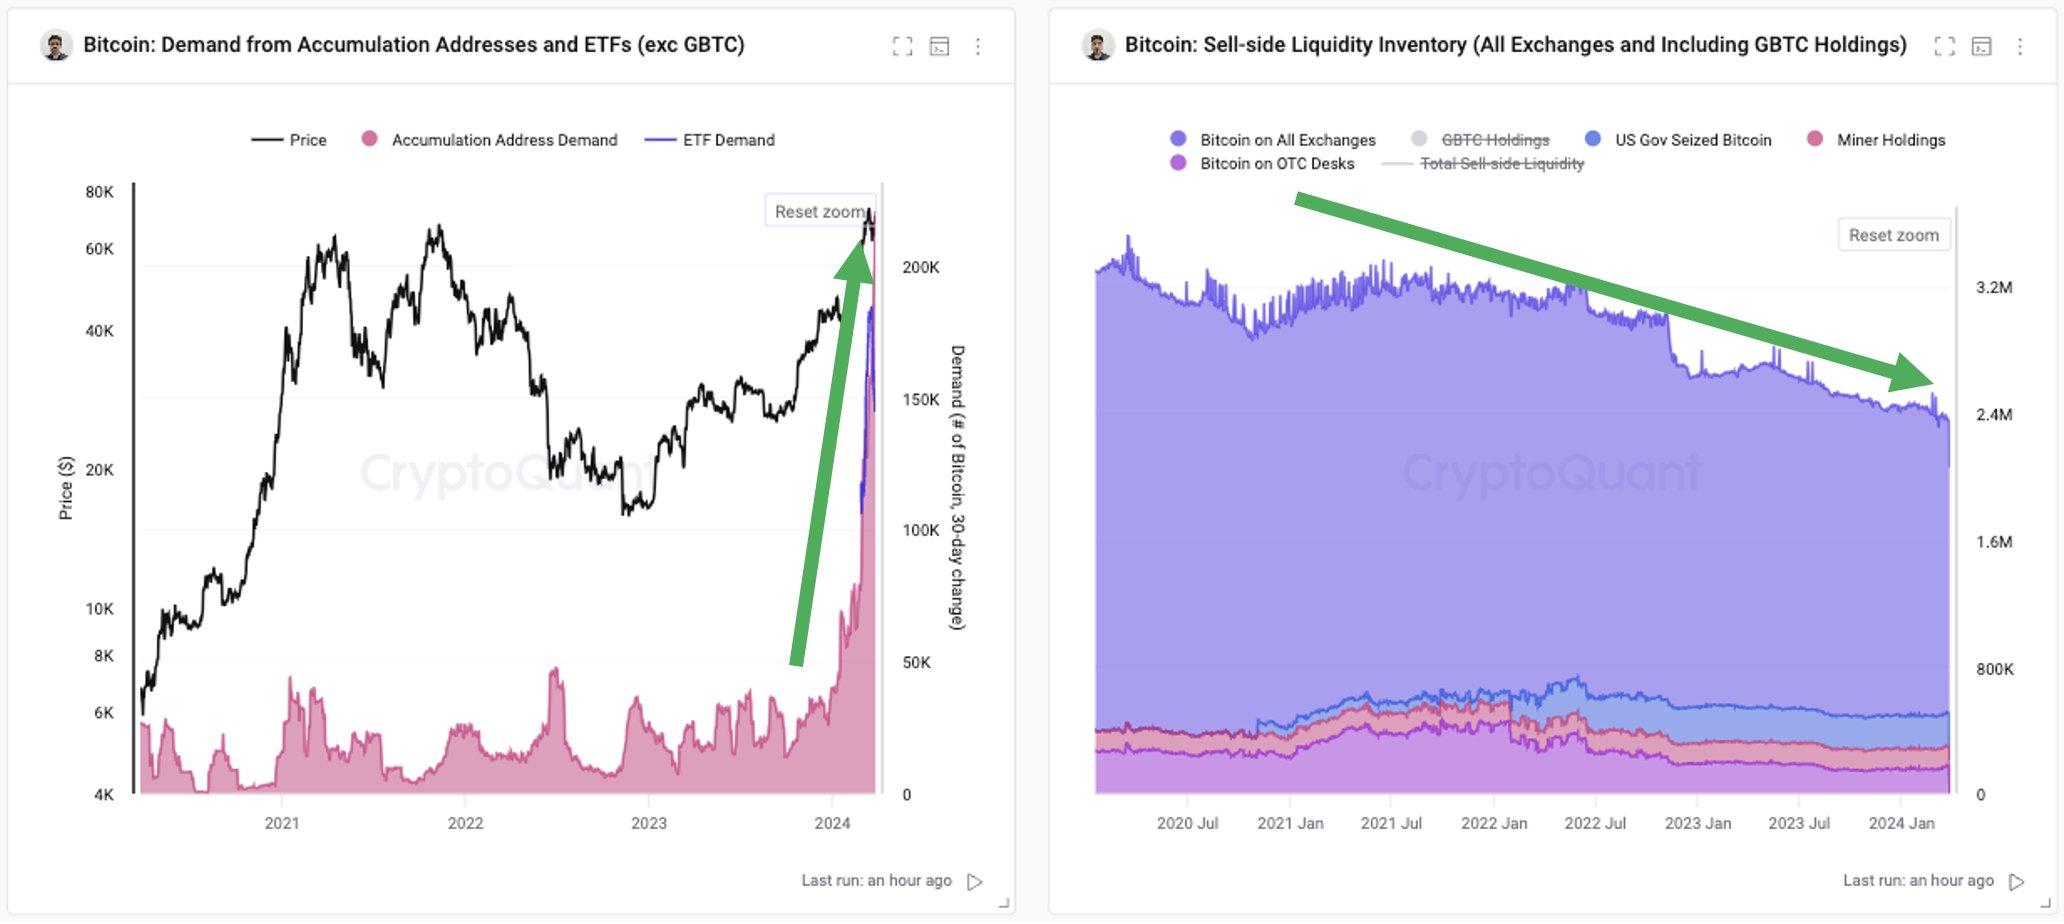
From the graph, it’s visible that the sell-side liquidity of the cryptocurrency has been heading down for a while now. This decline is mostly driven by the depletion of exchange reserves, as investors have been continuously pushing towards self-custody, possibly preferring to hold onto their Bitcoin for extended periods.
The chart on the left displays the trend in the total demand for the asset. Here, the demand is measured using the 30-day balance changes of “accumulation addresses.”
The accumulation addresses are those that have a history of only buying BTC and no history of selling. Exchanges and miner entities are excluded from this cohort, of course, as they count under the sell-side liquidity instead, regardless of whether they satisfy the condition for accumulation addresses or not.
Clearly, the demand for Bitcoin has exploded recently as new players like exchange-traded funds (ETFs) have entered into the arena. All this BTC is potentially going out of circulation and being locked into the wallets known for hosting a one-way traffic.
Given these two developments in the sell-side liquidity inventory and demand, it’s not surprising to see that the Liquid Inventory Ratio, which measures the ratio between the two, has plunged recently.
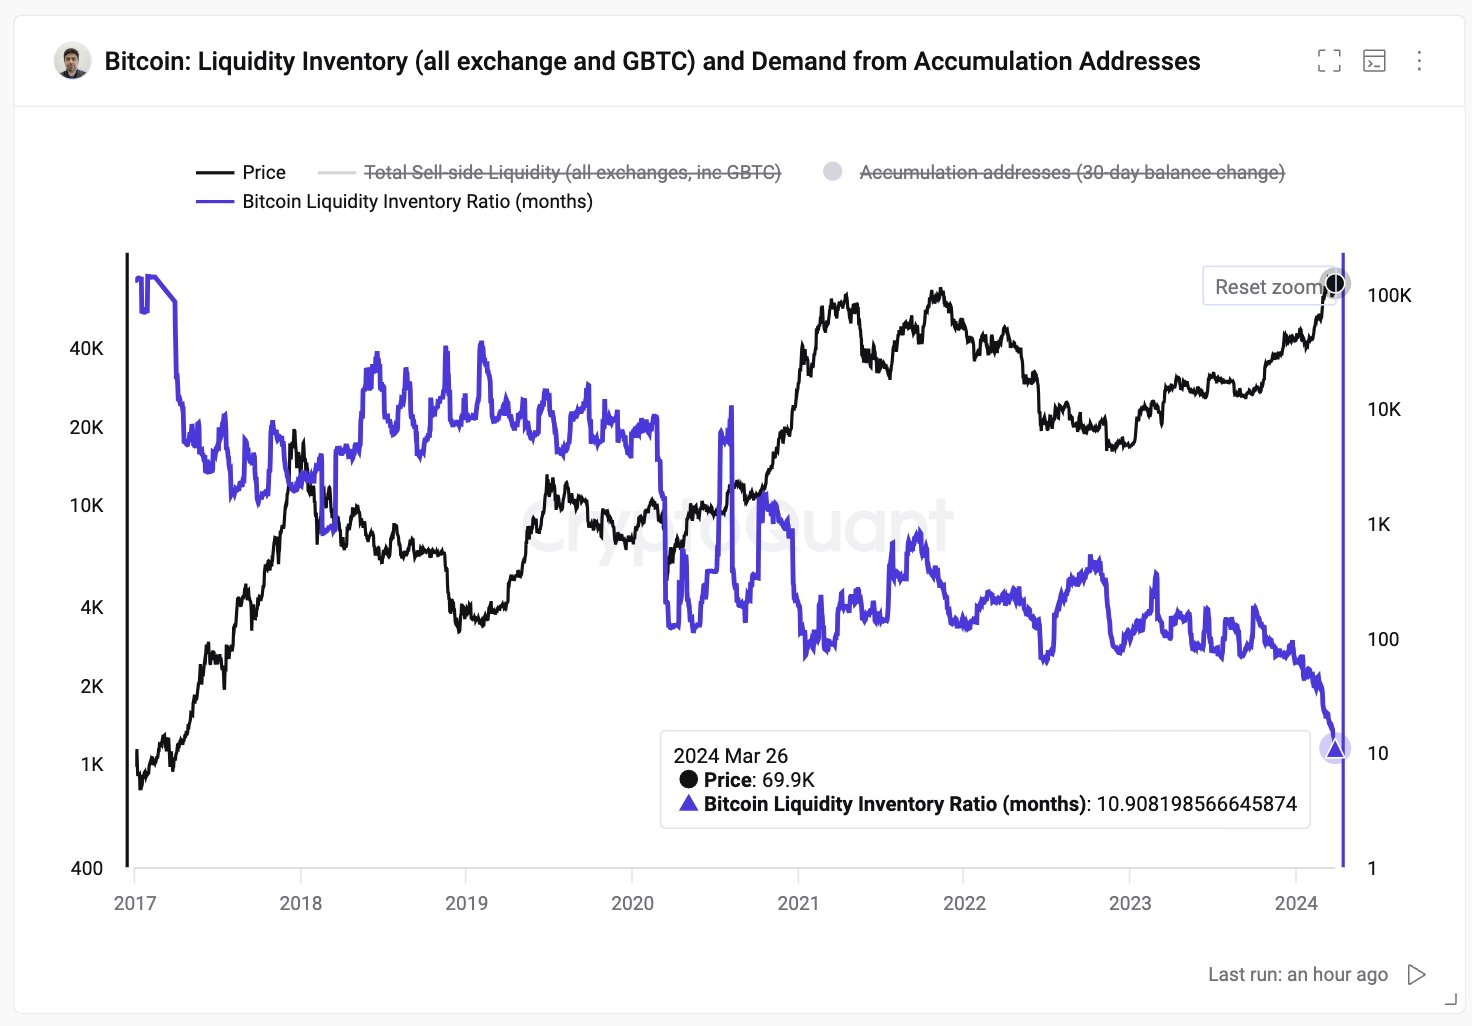
Following the latest decline in the indicator, its value has, in fact, dropped to a new all-time low. This means that the sell-side liquidity has never been this low when compared to the demand for Bitcoin.
Given this trend, it will be interesting to see how the BTC rally plays out from here, as the supply available to buy is only continuing to tighten.
BTC Price
Bitcoin had seen some drawdown earlier, but bullish winds have seemingly returned for the coin as its price has now recovered back above $70,200.